
How do you measure academic program demand? The former CFO at Stanford discusses 5 key indicators that can help you gain confidence and clarity in your academic program decisions.
by William F. Massy, Consultant to Higher Education, Former CFO at Stanford
Universities can no longer take the sustainability of their academic programs for granted. Pressures on institutional finances and disruption and volatility in the student marketplace makes it necessary to perform systematic sustainability analyses across one’s whole portfolio of programs. Sustainability has both academic and financial dimensions. This places it close to the heart of strategic decision-making. Academic Impressions (AI) has been working on how to help people responsible for resource allocation add program sustainability as an area of focus.
AI’s upcoming program on Academic Resourcing Models for Evidence-Based Decision-Making will introduce participants to the indicators, concepts, and best practices associated with program sustainability analysis. These can stimulate and inform needed conversations about sustainability among both academics and administrators. There are several reasons why such conversations help leaders get things done:
- Colleges and universities must deal with the inherent complexity of intellectual work and the needs and expectations of those who perform it.
- Academic resourcing requires the integration of disciplinary, financial, and market-oriented knowledge and skills. This requires bridging the cultural gap that separates professors, academic administrators, enrollment managers, and financial specialists – a goal that is best achieved through conversational interactions.
- Finally, mission considerations are highly subjective and often controversial. At the end of the day they are the province of senior academic leadership, subject to shared governance considerations, which again places a premium on frequent conversation.
But not just any conversations. They need to be mindful, informed by evidence, and guided by a shared conceptual structure wherever possible. Uninformed and unstructured conversations tend toward dysfunctionality because they spawn chaos and controversy. The challenge, then, is to use appropriate concepts and data to build structure into the conversations without limiting their scope and independence.
5 Key Indicators and Why They Matter
The needed conversations are built around five broad indicators of a program’s academic and financial sustainability.
1. PROGRAM SIZE
Large programs tend to be more stable than small ones, but the variations that do occur are likely to have more important financial consequences. Therefore, institutions typically concentrate on the financial sustainability of their large programs. The exception occurs when multiple small programs are losing money, which may require remedial action.
2. MARGIN/CREDIT HOUR
“Per credit hour” figures provide significantly different information from aggregate ones. They are used for comparing courses and programs to identify potential areas for expansion and contraction and/or potential operating efficiencies. For example, large programs with relatively low margins/credit hour may be candidates for redesign even though they make significant money overall. These data and the data for Indicator #1 are obtainable from the new breed of ‘academic resourcing models’ that are changing decision-makers’ perspectives about how their institution’s ‘internal economy’ affects academic as well as financial performance.
3. MARKET PERFORMANCE AND PROSPECTS
Both student demand and competition matter. Modern market information systems provide detailed, forward-looking, and customized data about each program’s actual and potential student demand and competitive environment. This promises to do for the university’s ‘external economy’ what the academic resourcing models do for its ‘internal economy.’
4. CONTRIBUTION TO MISSION
This refers to alignment with the university’s goals, values, and roster of activities. The is the “business of the business.” Delivering on mission should be a primary and articulatable institutional goal, even though the contributions of particular programs are and will remain matters of judgment. Assessments of contributions can be obtained from statements by advocates, program reviews, and previous conversations about university priorities. These data cannot be codified, but they can and should be organized in a ways that are meaningful to senior academic resource allocators.
5. SUFFICIENCY OF RESOURCING
You need to consider whether the assigned human, physical, and financial resources are fit for purpose. Data can include average class sizes, teacher types, room configurations for plenaries, breakouts, and labs, and the demands on faculty effort for different kinds of teaching tasks. For example, programs where class sizes, teaching loads, and adjunct usage are growing relative to benchmarks show evidence that may point to resource insufficiency. Forcing professors to work beyond their comfort levels or students to work under suboptimal conditions undermines academic sustainability.
All the data needed to calculate these indicators are available from today’s academic resourcing and marketing information systems. The academic resource management models also provide data on the courses that students take as they complete their degree requirements, which are essential for interpreting and acting on the indicators. Many of the available interventions with respect to program sustainability require attention to curricula or the individual courses that make it up. (Pure program-level decisions include admissions targets, pricing, and financial aid.) A good data system will make this information available along with data on the indicators themselves.
“But We Aren’t a Business…”
One question that often nags faculty and academic administrators also needs to be cleared up. It’s whether the aforementioned focus on program and course-level margins should be viewed as strictly a financial matter or whether it also has important academic overtones. Answers can be found in the so-called “not-for-profit paradigm” that guides decisions in traditional colleges and universities. There is space for only a brief explanation here. The essence is that not-for-profits maximize mission attainment subject to the constraints imposed by markets, requirements for resource sufficiency, and finances. (In contrast, for-profit universities maximize financial gain subject to the two constraints.)
The not-for-profit paradigm shows that positive margins are important not only for financial sustainability, but also because they allow the institution to cross-subsidize mission-critical programs that lose money. Without cross subsidies, it would be the market, not academic values, that dominates decision-making about programs.
There isn’t time in this article to describe how the data available for programs can be refined into metrics that bring life to the five indicators. Suffice it to say that today’s best-practice methods and tools do a fairly good job of accomplishing this purpose—and they are being refined all the time. Institutions must expend a certain amount of time, effort, and money in order to obtain the metrics, but this is amply rewarded with better decision-making.
A Proposed Program Portfolio Matrix
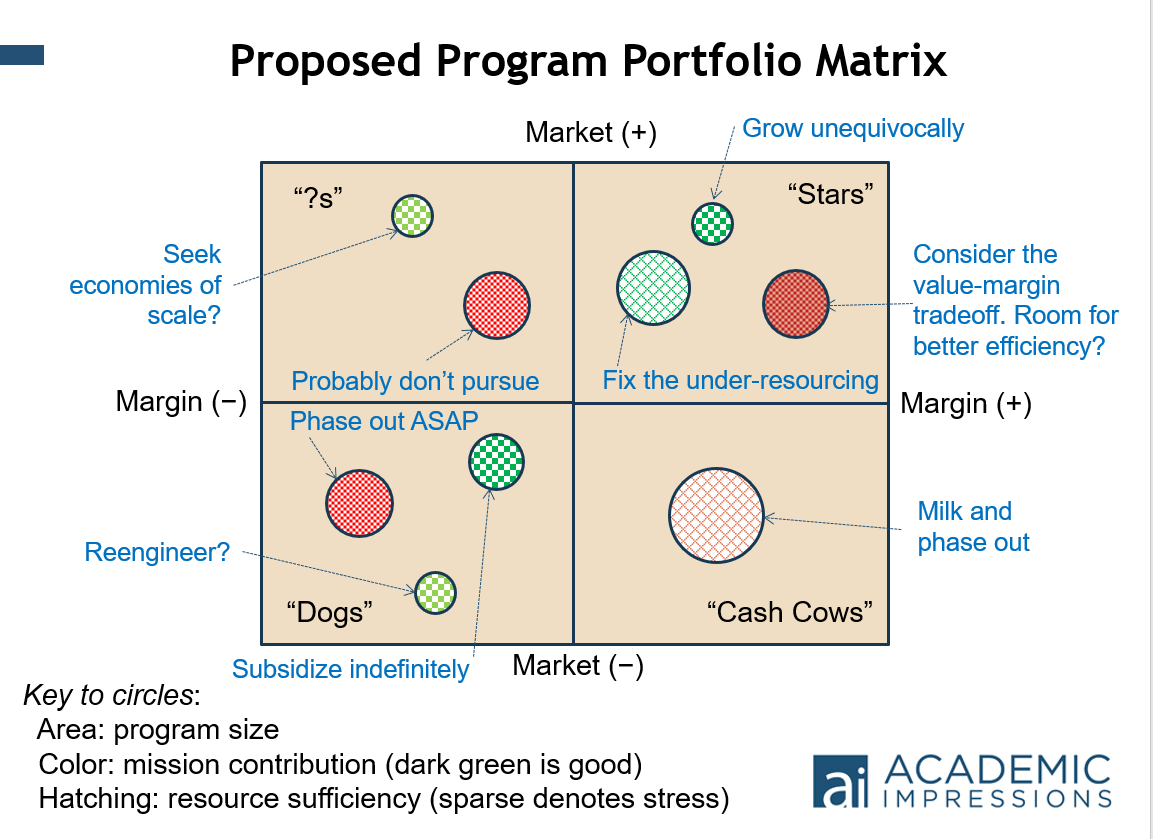
In closing, let me introduce the idea of a Program Portfolio Matrix that arrays data for all five indicators in a single diagram that can stimulate the needed analysis. The matrix adapts the Boston Consulting Group (BCG)’s classic “profitability-growth” matrix for product portfolios to fit the problem of university program evaluation. We begin with a two-by-two table that displays margin on the horizontal and an appropriate market index on the vertical dimensions. Programs are represented by circles positioned in the body of the table. The circles’ area represents program size, fill color represents mission contribution, and intensity of cross-hatching represents resource sufficiency. The idea is to differentiate programs according to the kinds of things one should consider when doing the review.
For example, some programs will look like “stars” (to use the BCG terminology) because they have high margins and positive market prospects, but true star status also requires a strong mission contribution and sufficiency of resourcing. On the other hand, high-margin programs with lackluster market prospects might be viewed as “cash cows” that should be maintained as long as possible without significant new investments and then phased out. Academic resourcing managers will wish to perform different analyses for programs with different combinations of attributes, and the portfolio matrix points the way for doing so.
At the end of the day, the objective is to use the university’s annual resource allocation process for more than simply making ends meet. Each budget exercise should nudge the institution toward enhancing mission contribution within the limitations imposed by its internal and external environments. The fact that these environments change constantly as the result of new opportunities and disruptions means the nudging process never ends. That, in turn, requires a resourcing information system that provides the kinds of data described above: for every program, course, and department, on a recurring basis year after year. This has long been the Holy Grail for university management, and now the needed systems finally are becoming affordable for most if not all institutions.
Today’s challenge is to marshal the will and expertise needed to acquire and use these systems. Among other things, this will require that academic officers accept their role in leading the new kinds of program reviews and in convincing professors that they too have an important role to play. It also will require that financial officers and staff facilitate these endeavors, actively and collegially.
__________________________
Image Credit: The photo at the top of the page is by Ousa Chea on Unsplash.
Learn More
Use market and financial data to gain confidence and clarity in your academic program decisions. Come learn more at:
Academic Resourcing Models
for Evidence-Based Decision-Making
December 5 – 6, 2019 | San Antonio, TX