
Having read in the last post about how marketing is an integral part of every college or university, it’s natural to wonder about the markets themselves: Who are they? Where are they? How have markets changed? And, especially in times of economic uncertainty, are there new markets we should be looking at?
The good news is that there is considerable data out there to help you make decisions about marketing; the bad news is that those decisions—while grounded in solid data and information—are still as much art as science. Motivations of markets tend not to be easily quantifiable or predictable, and even though you may take some of the lessons you learn from one market to another, it’s still likely a “one size fits all” approach won’t suffice if you want to do as much as you can, given the natural limitations and constraints on resources. As Yogi Berra is popularly quoted as saying, “It’s tough to make predictions, especially about the future.”
And while you look externally at markets, using all the information available at your fingertips, it’s still important to realize that there are many forces external to your university that you can’t control no matter how big your budget. It’s natural to ask whether it’s still worthwhile to even look at this demographic data. The answer, I think, is most certainly yes.
It’s fortunate, but not a surprise, that the best information available on student populations is on high school students, because (in 2020) the 14.3 million undergraduate students in the U.S. included 2.7 million first-year students (and the other 11.6 million were at one time, of course, first-year students themselves). The federal government and the Western Interstate Commission on Higher Education (WICHE) produce reliable estimates of high school graduate numbers each year, and the government also has excellent data on participation rates. And of course, the U.S. Census Bureau can give us a very good snapshot of the population as a whole, which is especially important if your college or university has larger populations of students who enter as transfers, who start as first-time students after their 22nd birthday, or if your institution mostly or exclusively offers graduate degrees.
Demographics are not destiny, and this is perhaps the most critical point as you look at what your markets look like for the next three, five, or ten years. And that truth can be applied either optimistically or pessimistically; the number of high school graduates, for instance, has been rising since 2014, but undergraduate enrollment in the U.S. has been falling ever since. It’s just wrong to assume that we will always be able to skim a certain percentage of that population off the top and go from there. Similarly, it’s also wrong to assume that negative outlooks going forward doom us to lower college enrollment in the future.
On that latter point, consider that the government could decide it was concerned about rising tuition and intervene with incentives or programs to lower the cost; or consider that colleges might find a way to tap into the 39 million adults in the U.S. who have some college but not a bachelor’s degree. Both of these, of course, might seem far-fetched at the moment, and both of these would require changes in the way we think about markets. Colleges who are willing to think differently and modify their offerings are most likely to survive and thrive at any time, but especially in crisis.
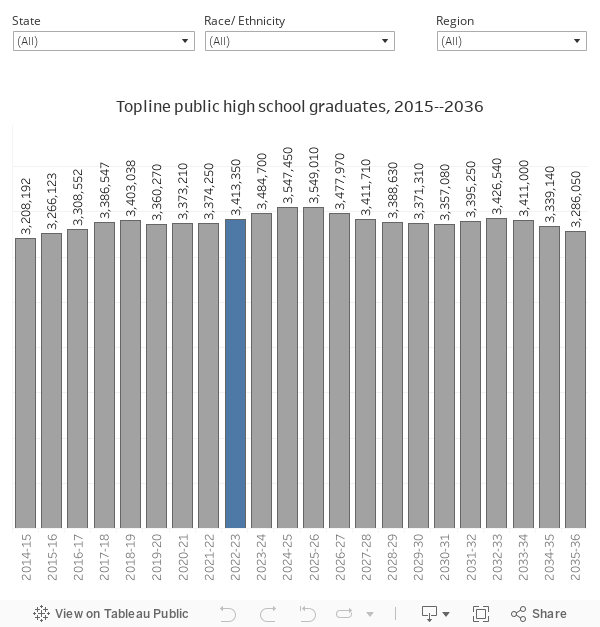
Let’s take a look at the population of high school graduates—not as the definitive take on markets, but as a place to put our feet down—and see whether the much-discussed “demographic cliff” is likely to affect higher education the way you might think. The visualization below uses data from WICHE, which mirrors federal data but provides more granular estimates using student ethnicity and breakouts by home state.
How you look at this will depend largely on what type of institution you work for, and where it’s located. Before you do anything else, see how these topline numbers, which give a high-level overview of trends, vary depending on the geographic region you choose, using the filters.
Compare New England and the Great Lakes states to the Southwest, for instance. But suppose you work at a public university in Texas, where the state essentially mandates that almost all of your freshmen are to come from in-state. In that case, look at your state. Or suppose you are in Washington, and you realize that the Far West region is mostly driven by California, and you need to drill deeper. Or suppose you are on the east coast and—like a lot of colleges—enroll large numbers of students from New Jersey. State boundaries matter a lot in college migration.
Resources: Before you go any farther, ask yourself if you know where your freshman class comes from, and how it’s changed over time. You can use the last tab on the visualization embedded in my blog post, here to find out.
As I’ve already mentioned, however, geography is one thing. Ethnicity and economics—two factors tightly connected in America—are another, and if your markets want something but can’t afford it, that’s not what an economist would call demand. It’s just a wish.
Thus, in looking at demographics, we have to drill into the raw numbers. On the visualization above, note how the bar chart changes dramatically based on the ethnicities you choose. Try selecting white and Asian populations first, and then select Latinx and African-American. You’ll note, probably, that one selection shows a decrease going forward, while one increases.
Even a very cursory examination of census bureau data will tell you why these trends might make colleges with tight budgets sit up and take notice. The populations that are growing tend to demonstrate lower median household incomes, while the populations that are shrinking are the ones with the highest median household income levels. So while you may take a look at raw numbers of high school graduates and think things are not as dire as you had heard, the combination of population and income may spell hard times for colleges that are high priced—especially for those that are not diverse.
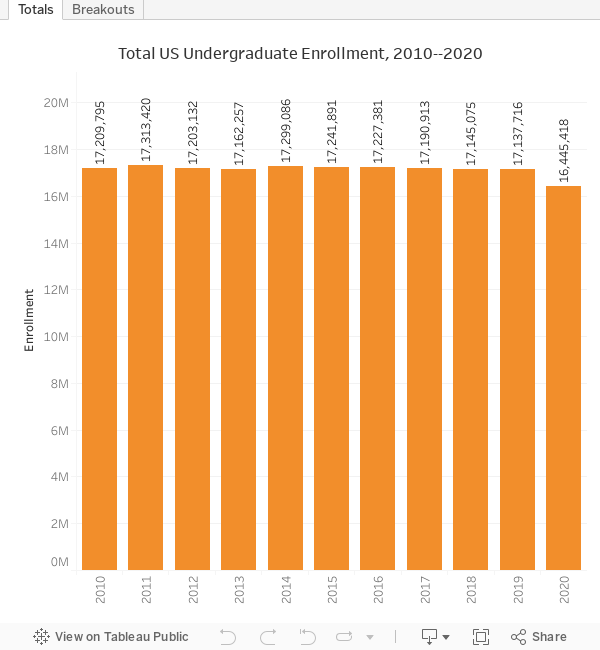
I mentioned above that demographics are not destiny, and that college enrollment has been shrinking since about 2014 or so. This, too, requires a little bit of drill down, because while the statement is technically true, there are patterns underneath the data that are more compelling. For this quick analysis, I looked at enrollment by institution type from 2010 to 2020 (currently the most recent available in IPEDS).
On the first tab, below, you’ll see that overall undergraduate enrollment has fallen. (IPEDS data is current only as of Fall 2020; reports suggest that the decrease in enrollment has escalated since then, driven by COVID and perhaps a tight labor market.) On the second tab, you’ll see it broken out by institution type. Four of the five categories: Major publics (land grants, flagships, and those with enrollment of 20,000 or more), for-profits, four-year privates, and other publics have all increased in enrollment since 2010. All of the drop in undergraduate enrollment is accounted for by community colleges. It’s not that this is not a problem, of course, but it does put the issue in some context.
What might explain that? The previously-mentioned hot labor market, a focus on brand names and prestige in higher education, or even the community college’s more passive approach to the market might be part of the explanation. It’s hard to say.
What if we looked at demographics with an opportunistic bent, rather than a fatalistic one? What if colleges shifted from thinking in terms of degrees to certificates? What if universities valued the growing population of adults with no degree? What if colleges purposely made themselves more attractive to students of color, or students whose parents did not go to college?
That’s how you can make sure demographics are not destiny, and how you can use information to influence where your college can and should head in the market.
Resource: Growing and Shaping Your Academic Program Portfolio in a Post-COVID Era – Academic Impressions
In my next post, I’ll talk about something that everyone knows about, but few understand: How recruitment works, and how it fits into both enrollment and strategic plans at the university.