“Will my students read these suggestions?”
“Will they learn from and apply my feedback?”
When I was a faculty member, the above questions nagged me and other colleagues as we spent hours grading final papers and projects. I carefully crafted feedback to identify strengths and offer suggestions, even linking to course readings and resources. I hoped students would reflect on my comments to replicate the positive or modify their behavior.
But at the end of each semester, I watched the pile of graded work sit in a box. At first, it was a cardboard box outside my office. Today it has become a virtual box in a learning management system. Students saw the end of the semester as the end of their learning, and I began to wonder whether grading final projects was worth my time.
Do your faculty feel the same about their administration? Are you letting faculty innovations “sit in a box?”
This year, faculty implemented unprecedented innovations as they pivoted to deliver online or hybrid educational experiences while adjusting to dynamic CDC guidelines as well as mounting mental and physical health challenges. They rewrote syllabi, modified assignments, and built and rebuilt online modules. At the end of each semester, do you ask how you can leverage these innovations? How can you demonstrate to faculty members that you witnessed and appreciate their passionate agility, and that you want to continue to learn from and build on their progress? You have an opportunity — if not an obligation — to honor their dedication and harness the innovative spirit they demonstrate.
Below are a few ways that we have used existing data to help drive both student and faculty success. Doing so will transform learning and position your institution for success. Not doing so is like adding to that pile of expertly graded papers sitting in the box — a waste of time and energy.
It’s on the syllabus: Collecting data
Every faculty member fields questions about content or expectations that are clearly articulated on the syllabus. Knowing this, be sure to collect existing information before asking faculty to gather information and consider the information in light of the unprecedented context we have faced. Using trend line or historically data allowed me to gain a richer understanding of the impact of COVID-19 while identifying opportunities that may not have been as apparent. Let me first provide some examples of how you can collect and analyze course level data.
Student course evaluations provide both a quantitative and qualitative snapshot of a single moment in time and often on a single item. Shifting to a cross-item analysis or historical comparison can reveal opportunities for faculty to continue or adjust. For example, how do items scored on a Likert-scale related to faculty “caring” or “availability” compare to past assessments and to each other? If students’ scores of caring and availability both increased from past years this suggests that remote office hours were successful. In the qualitative comments, what comments are paired? For example, does “hardest semester” pair with “learning” or “unavailable”? If the former, the students felt challenged, while the latter indicates they felt disconnected. Similarly, does “didn’t think I could” pair with “surprise” or “stress”? Gathering and reflecting on this data will help you identify opportunities for improvement that may not have been as apparent during pre-COVID semesters.
Course grades, including DFW rates, provide a base level for assessing student performance that may need to be address by the faculty or course design. You can compare grades across time, course modality, and instructor. Did one course experience higher numbers of D, F, or withdrawal grades (DFW rate) than in the past? How did online sections compare with hybrid sections? Did one section or instructor have significantly higher or lower rates than other sections or instructors? Faculty are rightfully sensitive to discussions about these topics since student performance can reflect a unique student experience. If a course or instructor has a continually high DFW rate, it could indicate that previous courses are not adequately preparing students or that the course learning objectives are set too high for the level of course. If an individual instructor’s DFW rate is higher than other instructors of the same course, facilitating grade norming exercises across units may help mitigate the differences. Finally, if DFW rates increased during COVID, the course may need some support if the department wishes to continue hybrid or online delivery.
For our college, the Offices of Institutional Effectiveness (OIE), Admissions and Enrollment Management, and Human Resources provided institutional data that serves as context for course specific data that was of particular importance this year.
- Fall to Spring retention rates are provided by our Office of Institutional Research OIE and then compared to previous years. If retention rates are lower overall, it suggests that retention and student satisfaction were affected by an external factor (e.g., COVID) that was outside the individual course experience. If student course evaluations skewed lower during this period, then we would interpret this as an external issue and not an individual faculty development opportunity.
- Student withdrawal rates can be collected from Admissions and Enrollment Management for the institution as a whole and compared to course rates. If institutional rates increased, then increases in student withdrawals from individual courses would also follow. This suggests that it is the situation not the course that is leading to a student’s decision to withdraw and a reassessment of the course may not be necessary.
- Track student commitment pipeline and trendlines. Universities track the date students accept admissions offers, deposit for tuition, deposit for housing, and more. During COVID, students’ uncertainty about attending college lead them to commit later and to more institutions than historically. This resulted in a surge of students looking for classes right before the start of the semester or fewer students in classes that had been planned. In the latter case, producing courses where the number of students enrolled was below our institutional policy. Understanding this data will allow our college to plan for a more agile course schedule. One that ensures faculty have the opportunity to prepare courses that will meet student learning outcomes while responding more quickly to changing needs for specific courses.
As you collect and analyze this data, be sure you have followed the university handbook (e.g., syllabus) as to the appropriate procedures and data use. Regardless of expectations in the handbook, partnering with a neutral individual or group to collect and evaluate this information can help detach emotion from data.
How can I get an A?: Creating meaning around data
Students want to succeed, but sometimes they need faculty to help articulate the measures of success. For example, why did a paper earn an A or B? What is the grading rubric? Similarly, faculty want to succeed and want to know administrators see the scope and achievements of their work. As you collect information and provide feedback, make sure to articulate the “why” and identify strengths and challenges, so faculty members can replicate or modify to “get an A.”
Our world is overrun with data that needs structure to create meaning and paths for action. To create that structure, organize information into categories that can help you bring faculty and administrators together around a shared purpose that creates impact. As an administrator, my role is to help faculty meet the institutional and college level strategic goals. That is, if you will, the rubric of what constitutes an A.
Categories can be developed via an inductive, deductive, or hybrid thematic analysis process (Nowell, Norris, White, & Moules, 2017). During inductive thematic analysis, themes emerge from the data as similar ideas are sorted into categories (e.g., apple, pear, orange = fruit). Deductive thematic analysis sorts data into preconceived themes such as the institution’s strategic goals. In a hybrid thematic analysis, themes identified inductively can be categorized into preconceived themes to evaluate how the actions support or challenge the overall vision for the future.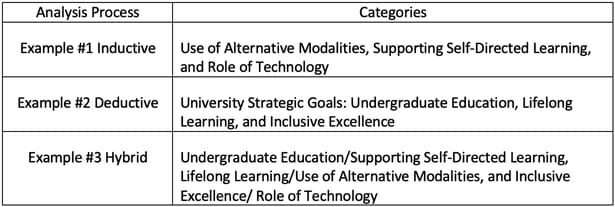
Regardless of how you chose to organize the information and create meaning, it is imperative that you also provide faculty support so that they develop self-efficacy and recognize their success. This Fall, I provided every faculty and staff member with a notebook and a bar of chocolate so they could record their successes and to remember the sweetness of what they do. During a virtual college assembly, I shared some of their successes, also linking them to a university or college strategic goal.
Reflection solidifies learning: Synthesizing and amplifying value
Faculty members work tirelessly to design classes that introduce students to new knowledge and skills. In Spring 2020, the COVID-19 pandemic forced faculty to reimagine, learn, and adapt. To build on evolving best practices, it is critical for administrators to create space for reflection and assessment.
Similar to in-class reflection exercises, ask faculty members a series of brief, open-ended questions that synthesize and extract the value of what they have learned and experienced during this unique educational moment. The exercise provides faculty members with an opportunity to share accomplishments and to identify what did and did not serve them. For example:
What innovations, practices, and strategies did you employ during the pandemic that…
- we should continue in the future?
- served you well during this unique environment, but do not seem to have value moving forward?
- did not add value or achieve the objective(s)?
Upon collecting this information, it is imperative that you respond. Otherwise, you have created another box in which innovation sits. Based on my experience as a scholar-teacher in organizational communication, I frame my responses in the following three categories:
- What I/we can do. I can adjust the deadline for submitting performance evaluations.
- What I/we cannot do and why. We cannot adjust the deadline to submit grades because it will delay student financial aid.
- What I/we will not do and why. We will not eliminate or reduce office hours, as they are an important element for student success.
Your work, our work, becomes transformational — not just for the moment — when we turn thoughtful reflection and assessment into clear paths for growth and meaningful action. This is a unique moment in history, and you have a choice: Go back to the way things were or form a new path paved by lessons learned and innovation. If you dare to engage in this moment, you need to (1) collect existing data, (2) create structure and meaning around data, and 3) ask faculty to synthesize and extract value from their learning and experiences. If you do this, you will not be left staring at a lonely box of unseen papers. You will empower and energize faculty to read your comments and contribute to a shared vision for transformative, inclusive higher education.
Thank you to Kate H. Elliott for her editorial assistance.
Work Cited
Nowell, Lorelli S., Norris, Jill M., White, Deborah E., and Moules, Nancy J. “Thematic Analysis: Striving to Meet the Trustworthiness Criteria.” International Journal of Qualitative Methods, vol.16, no. 1, 2017, pp. 1-13.